
Spatial data science
Whilst official monitoring of salinity concentrations of canals and rivers occurs regularly, these measurements often do not relate to what farmers are experiencing on farm. As soil salinisation increases over the course of the dry season, it is important to measure and record these on-farm readings to assist with the tracking and predicting of saline intrusion.
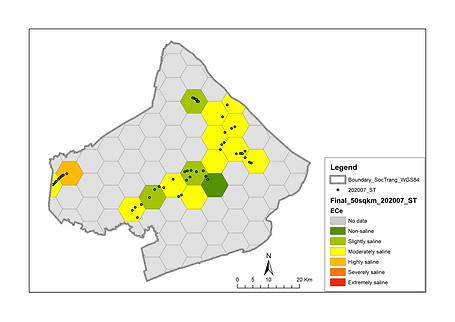
Farmers and DARD staff have been trained by the FOCUS project (see here) to measure farm soil salinity and record data on an app provided by the project. This georeferenced data reports soil salinity, soil gravimetric moisture content, location and time and allows the GIS team to map spatial and temporal changes in saline intrusion. These maps can be used in predicting management practice change and future modelling scenarios.

Salinity mapping
Farmers and DARD staff measure and record their farms data on an app provided by the FOCUS project. This georeferenced farm data reports soil salinity, soil gravimetric moisture content, location and time and allows the GIS team to map spatial and temporal changes in saline intrusion. These maps can be used in management practice change and future modelling scenarios.

Modelling
The combination of salinity spatial and temporal maps, change in land use data, field and soil data, and socioeconomic and gender studies will all contribute to a model that helps predict soil salinisation and identify suitable land use for alternative crops.

Land use change
The change in land use over time is being mapped using Sentinel-1 imagery. These maps can be used to show changes in rice production, forestry, aquaculture and orchards over time. The changes in rice production over time is split into provinces and linked to temporal environmental factors that impacted production.

Figure left: Predicted 90th percentile of water salinity under climate change, with sluice gates operating.
Eslami et al (2021)
